DevTools
See your whole database, watch every change, inspect query plans, and profile boot — in the browser. Built on the same hooks your app uses, and it tree-shakes to zero bytes in production.
Every panel, one keystroke away
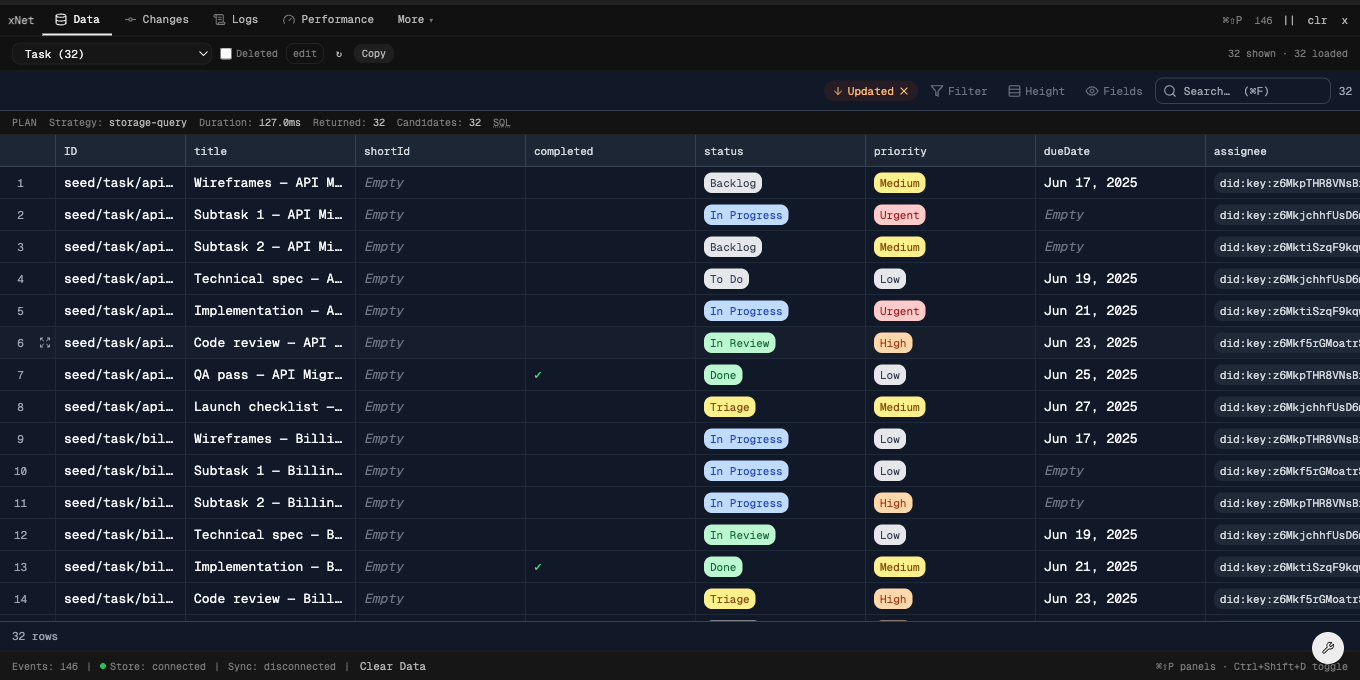
Data
Query and browse every node in the store on the same grid your app ships with.
- Live query-plan inspector
- Inline editing with per-cell permissions
- Sort, filter, hide columns per schema
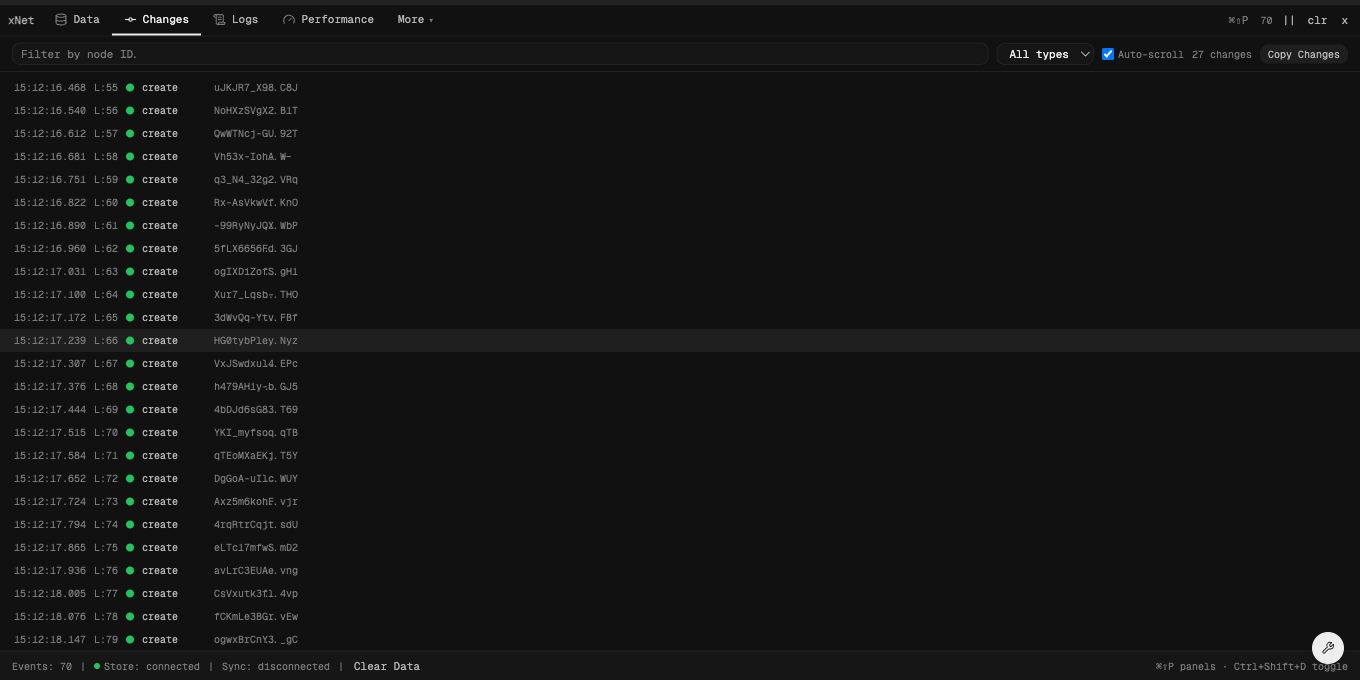
Changes
A live, Lamport-ordered feed of the CRDT change log — every create, update, and delete.
- Filter by change type or node
- Inspect the full change payload
- Follow remote changes as they sync
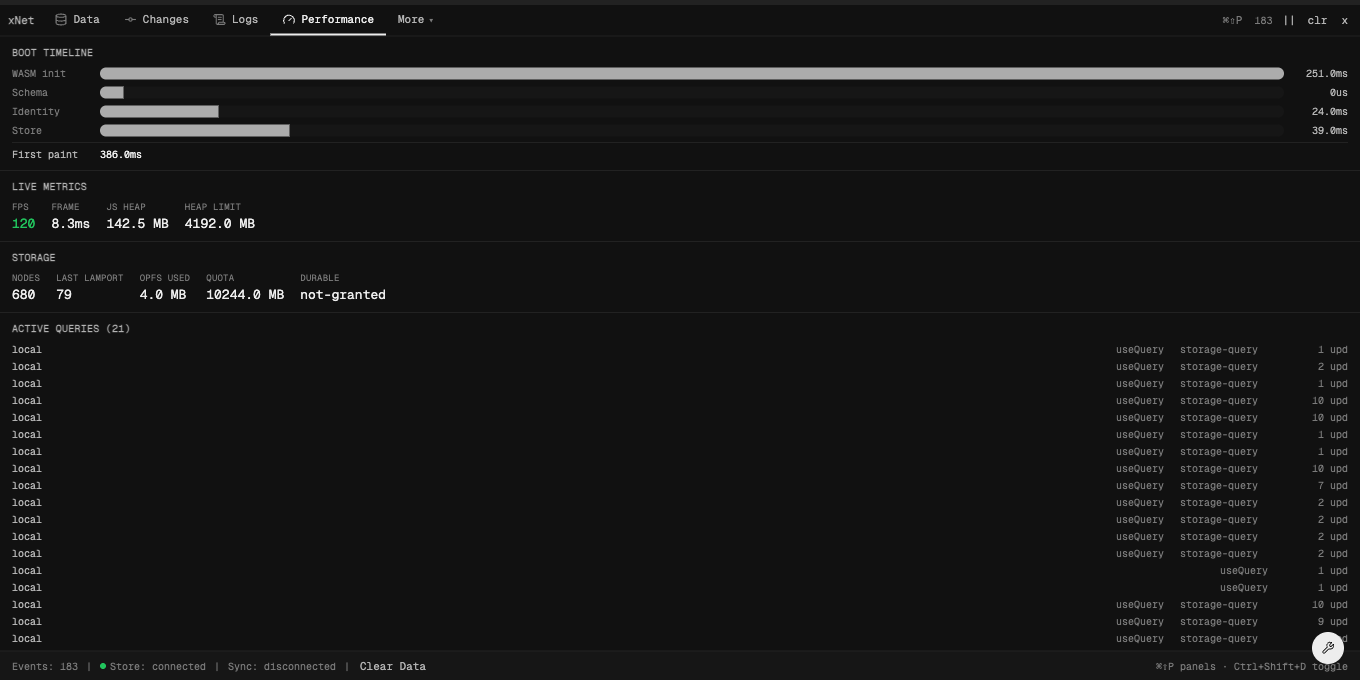
Performance
Cold-start boot timeline, live FPS and heap, storage status, and active query counts.
- Boot waterfall by phase
- Frame budget + heap sampling
- Active useQuery / useMutate subscriptions
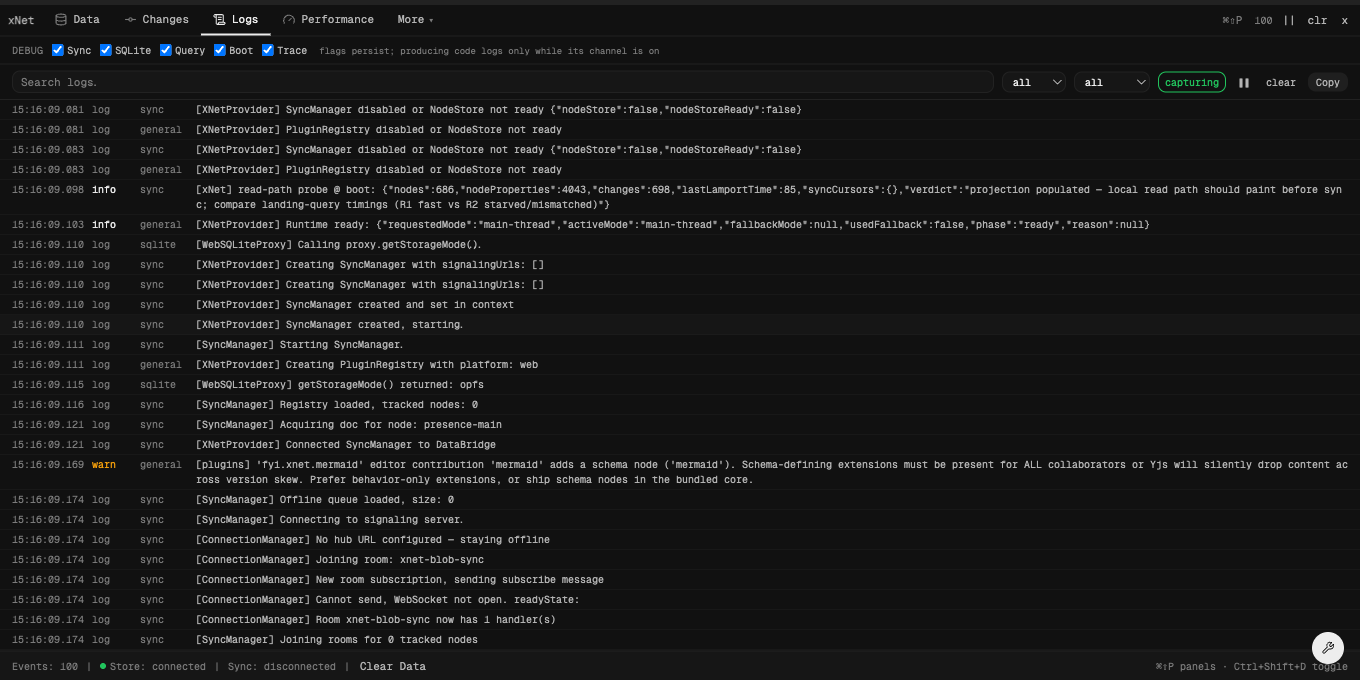
Logs
Toggle debug channels (sync, sqlite, query, boot) and search the captured console buffer.
- Per-channel on/off, persisted
- Level filter + full-text search
- Pause, clear, copy
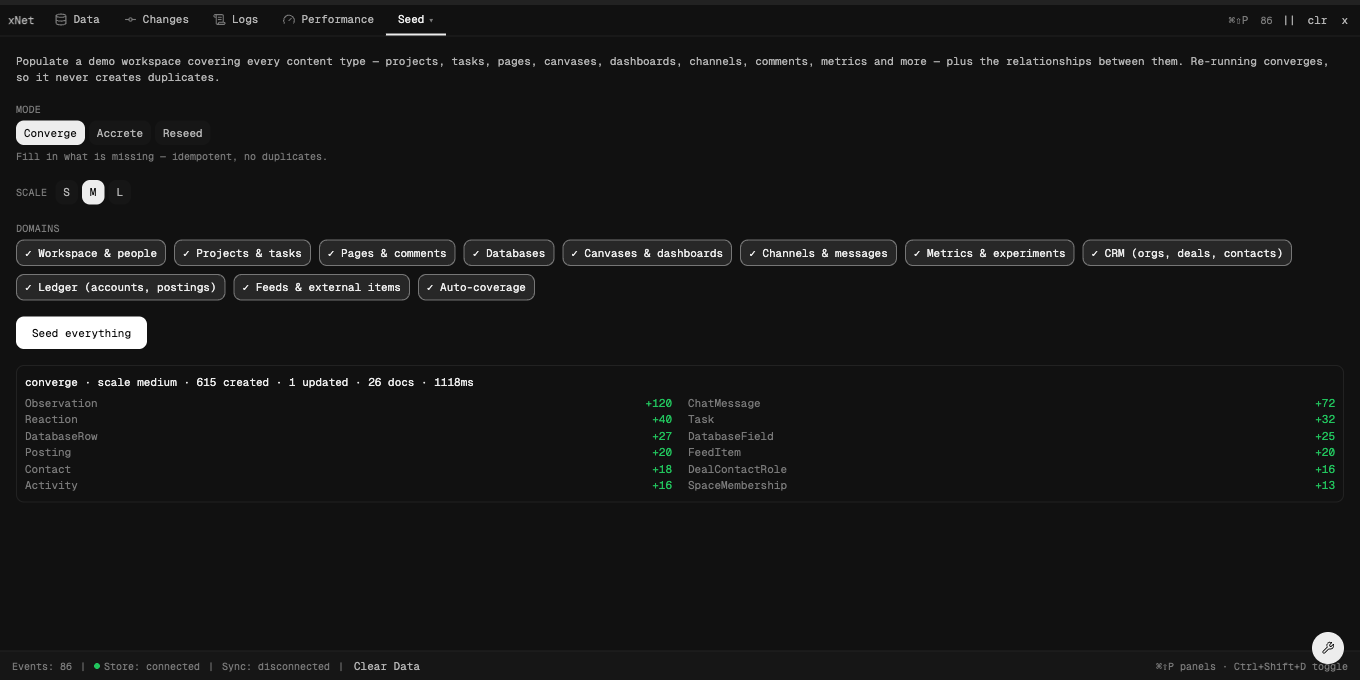
Seed
Populate a realistic demo workspace across every content type — idempotent and scalable.
- Converge / accrete / reseed modes
- Small → large volume knob
- Per-domain toggles (CRM, docs, …)
The Data panel is the same GridSurface +
useQuery your app ships with — so what you debug
is exactly what you build.
Turn it on
One provider. Dev-only by default.
import { XNetDevToolsProvider } from '@xnetjs/devtools'

<XNetDevToolsProvider>
  <App />
XNetDevToolsProvider>

// Press ⌘⇧D (Ctrl+Shift+D) to open. Tree-shakes to zero in production.Twenty panels
Hero panels stay visible; the rest are a fuzzy ⌘⇧P palette away.
Hero
- Data
- Changes
- Logs
- Performance
Data
- Schemas
- Schema History
Activity
- Sync
- Queries
- Traces
- Telemetry
Protocol
- Yjs
- AuthZ
- Abuse
- Security
- Version
- Migrate
Tools
- Seed
- History
- SQLite
- Reset
Build with confidence
DevTools ships with xNet React. Start with the hooks and open it with ⌘⇧D.